# 12. Debugging
# 12.1 Variable Monitoring
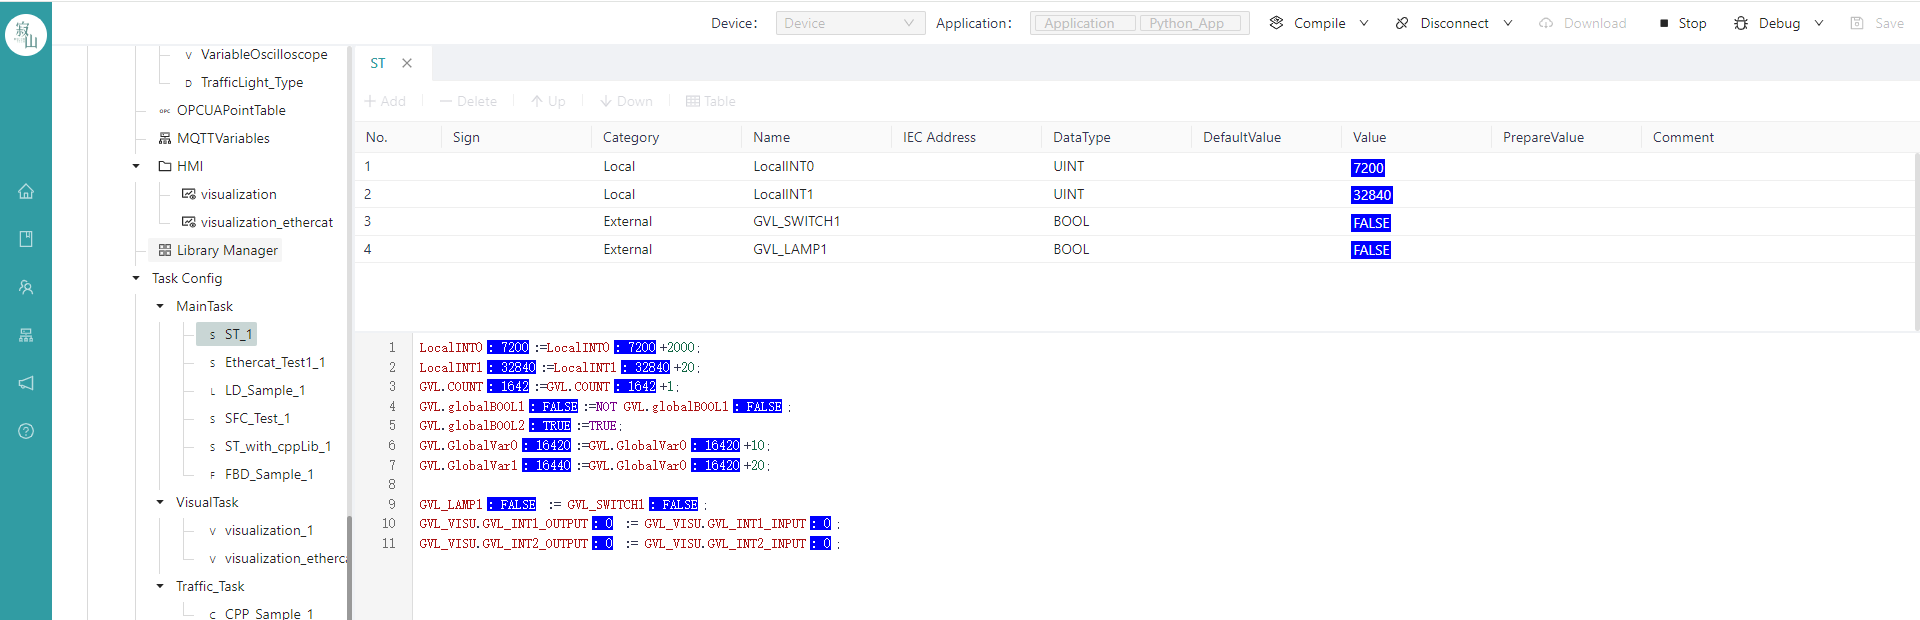
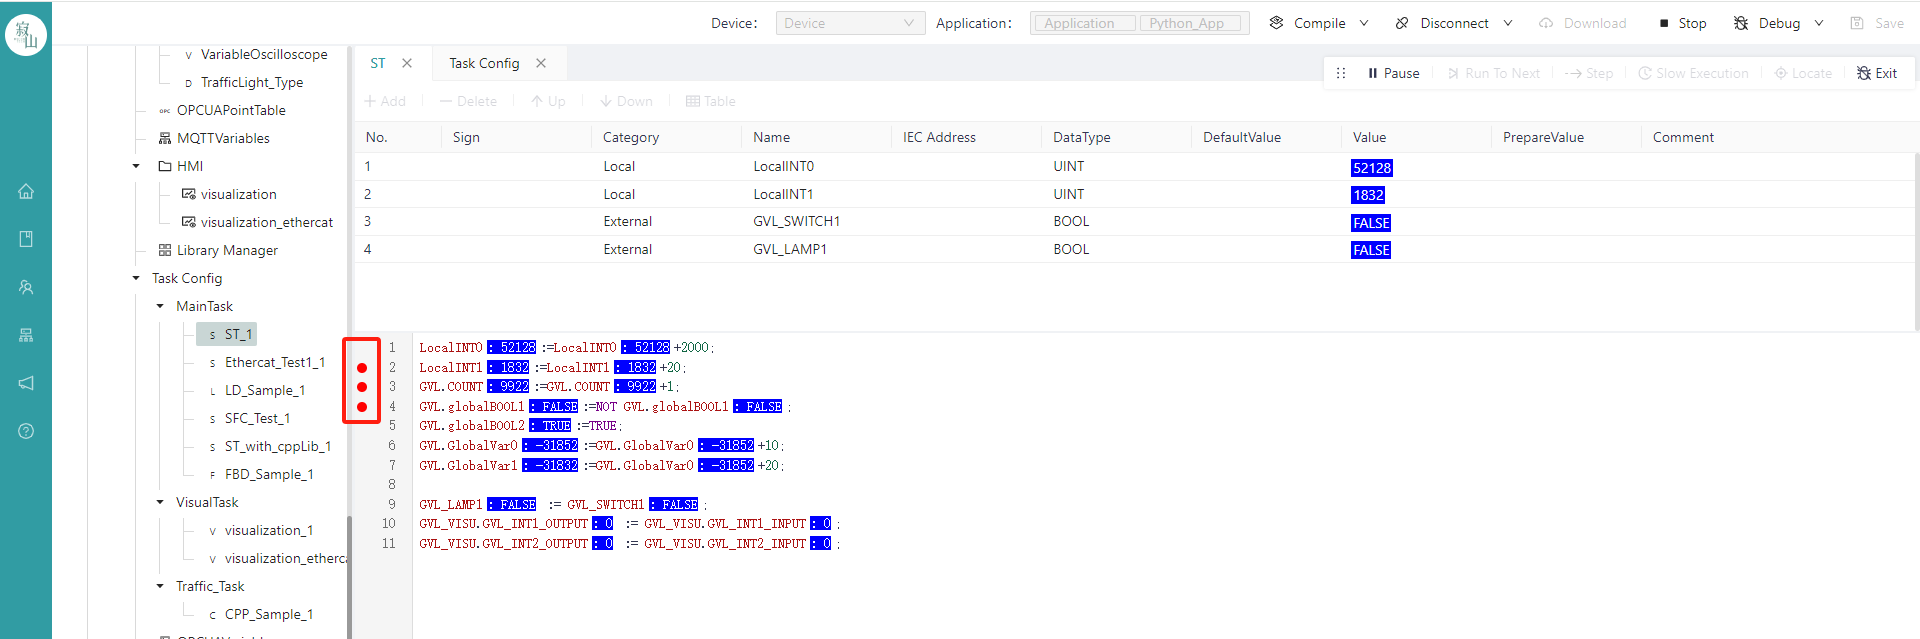
When a task is running, click a task under Task Configuration on the left to monitor the variables in the task in real time.
# 12.2 Task Monitoring
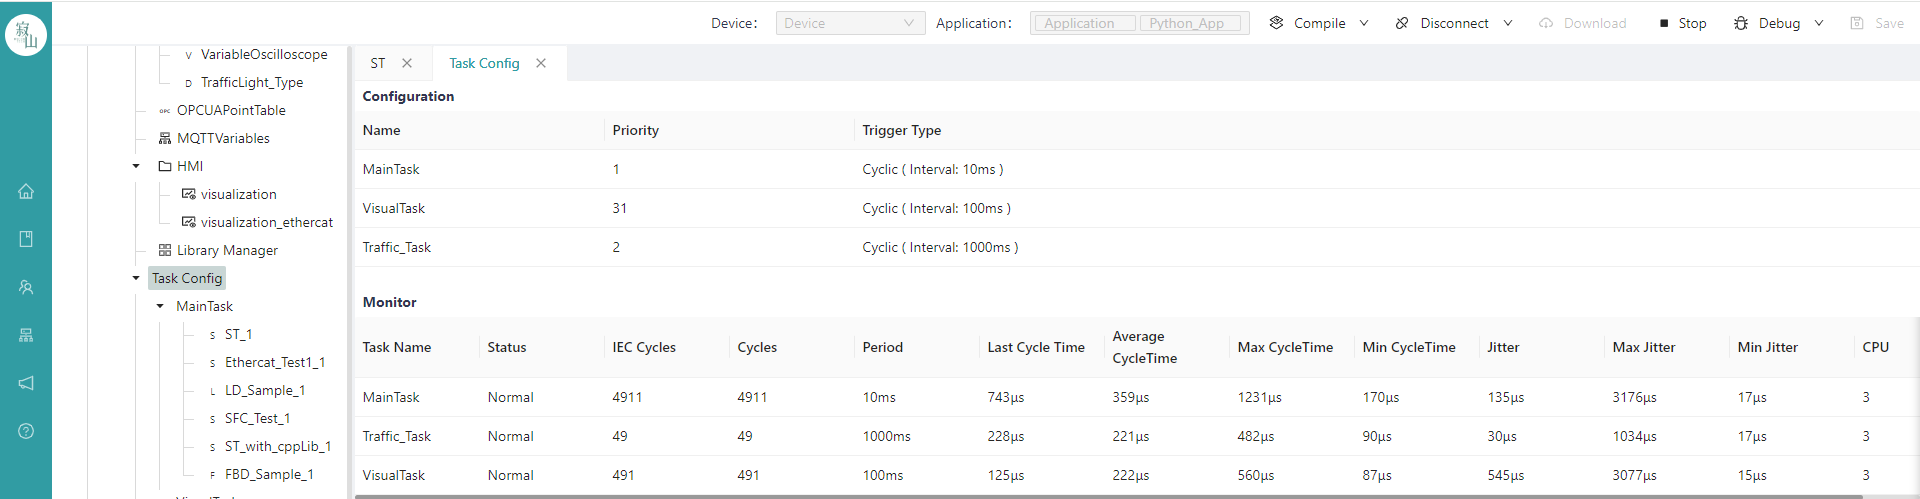
When the task is running, click "Task Configuration" on the left menu to view the current cycle time, cycle number, cycle time, jitter time, bound CPU and other information in the "Status Monitor" module.
# 12.3 Using Breakpoints
When a task is running, you can add breakpoints to programming languages such as ST or LD after the debugging mode is enabled.
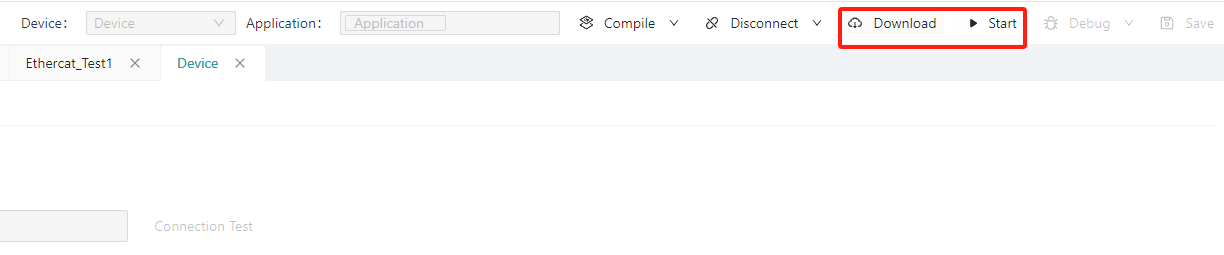
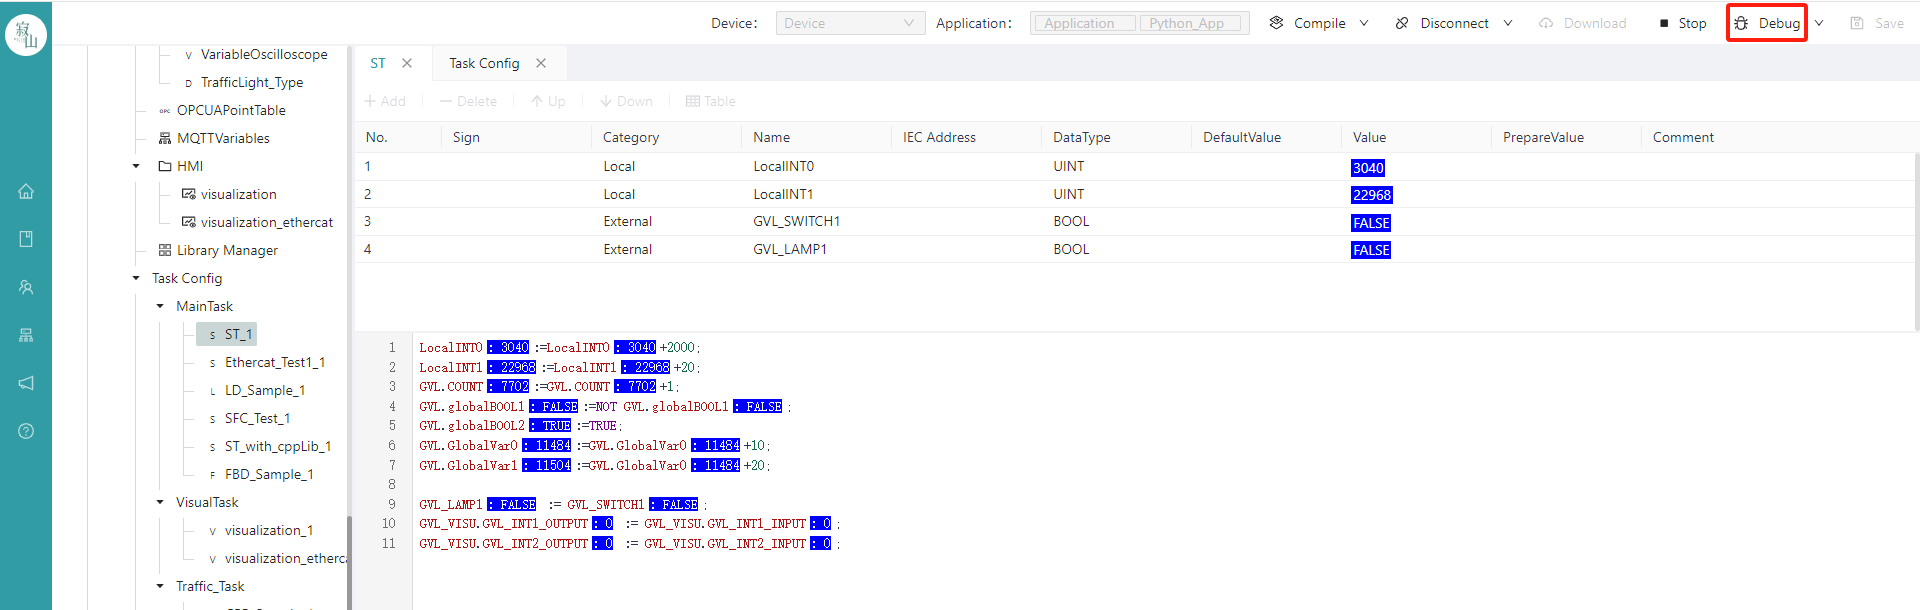
First of all, by clicking the "Debug" button on the top right, make the task enter the debugging mode.
After entering the debugging, in ST programming, click the blank space before the line number to add a breakpoint.
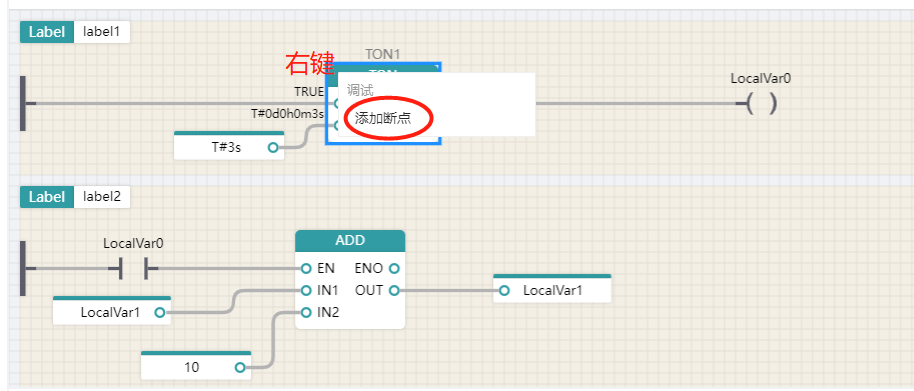
In LD programming, if you want to add a breakpoint, you need to right-click the function block to add a breakpoint in debug mode, and select Add Breakpoint.
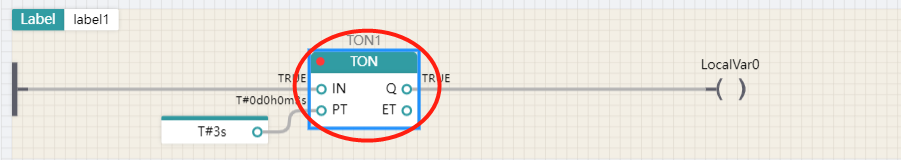
After the breakpoint is added successfully, a red dot will be displayed at the top left of the function block, as shown in the following figure:
Click "Run to the next breakpoint" in the modulation tool to debug the breakpoint operation.

Click "Locate to Current Breakpoint" in the debugging tool to jump back to the current breakpoint.

# 12.4 Single-Step vs. Slow Operation
In debugging mode, users can step through the program and run it slowly as needed.
After entering the debugging mode, first click the "Pause " icon in the debugging tool.
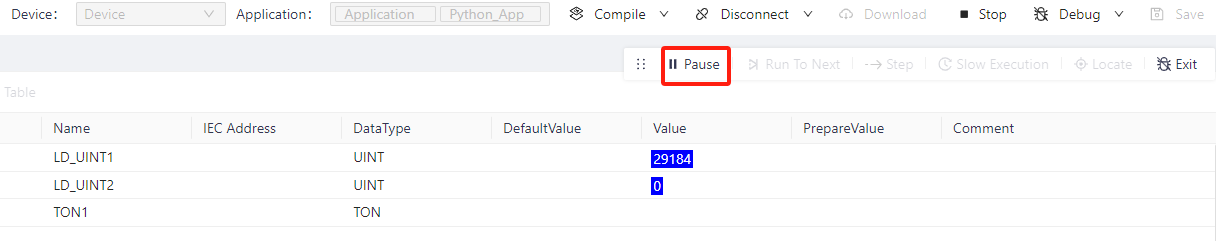 After clicking Pause, tools such as Step-By-Step and Slow Run of the debugging tool will become available.
Click the "Step Run" button, and the task debugging is executed to run the step.

Click Slow Run to debug the task and run it slowly.

# 12.5 Variable Writing and Variable Forcing
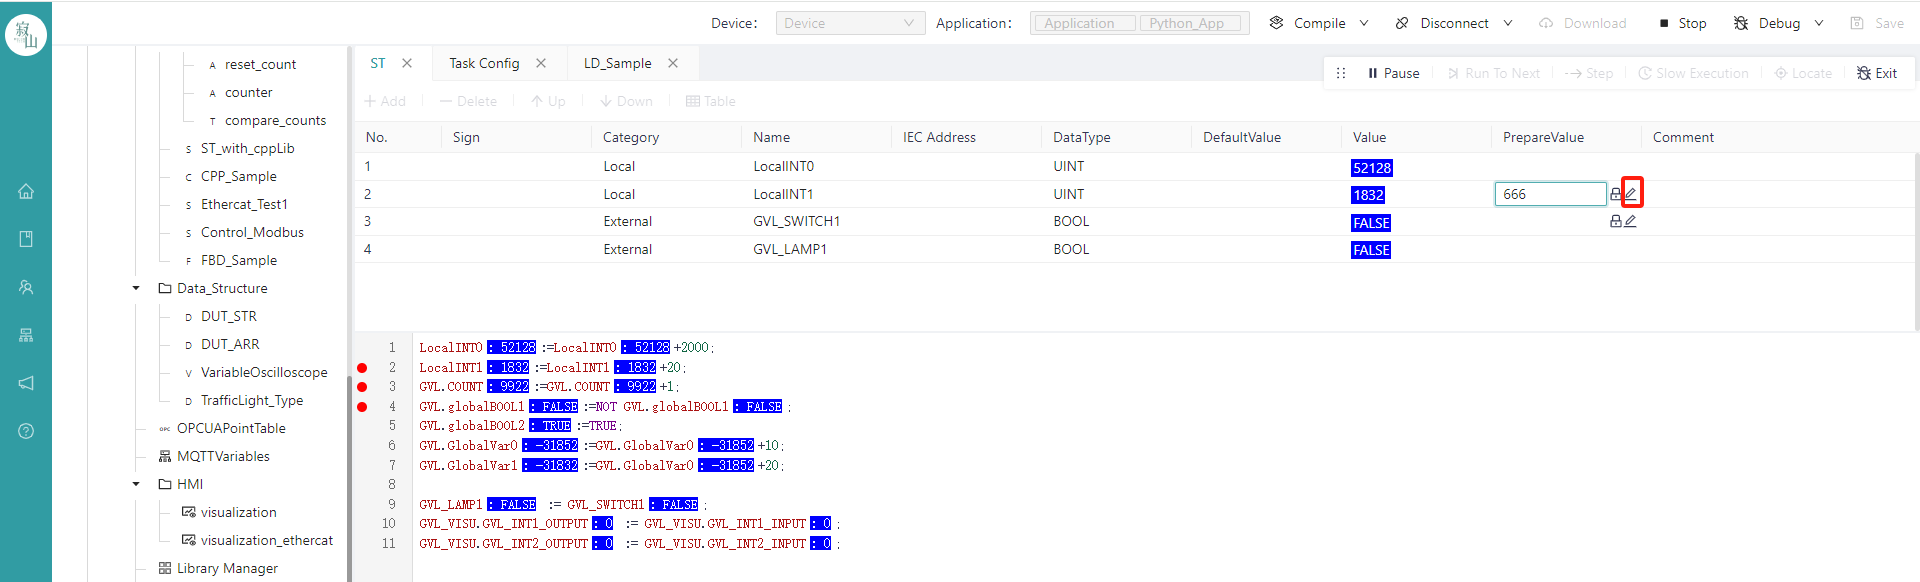
During the movement of the program, variable writing and variable forcing functions can be performed.
Enter the preset value in the preparation value of the variable, and then click the "Write" icon to execute the write, and the variable is updated to the written value.
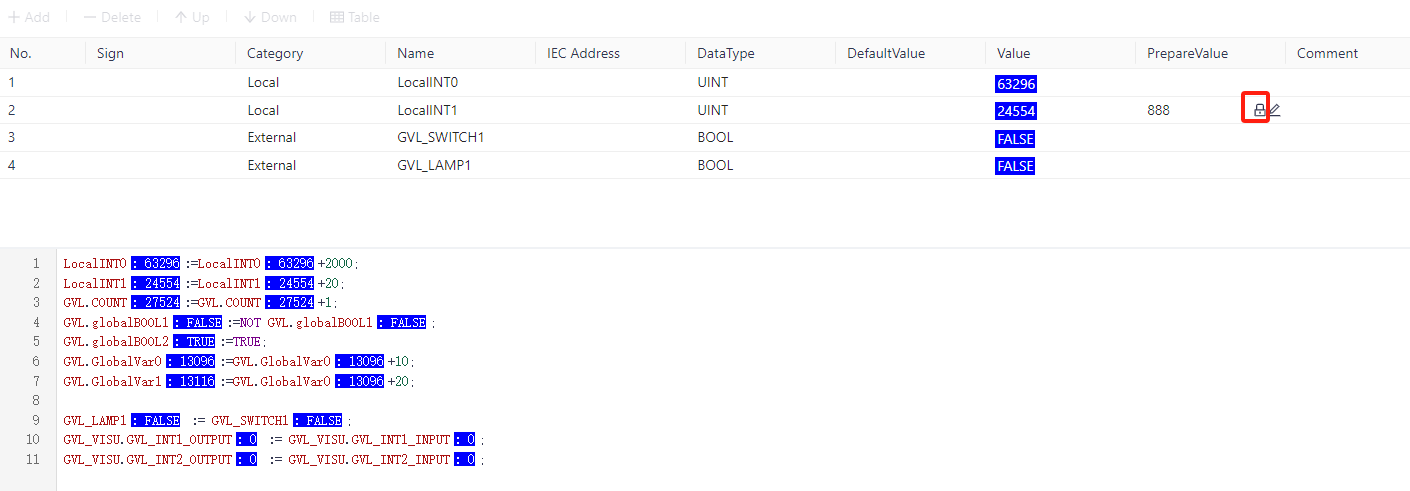
In the preparation value of the variable, enter the preset value, and click the "Force" icon to lock the variable to the mandatory value.
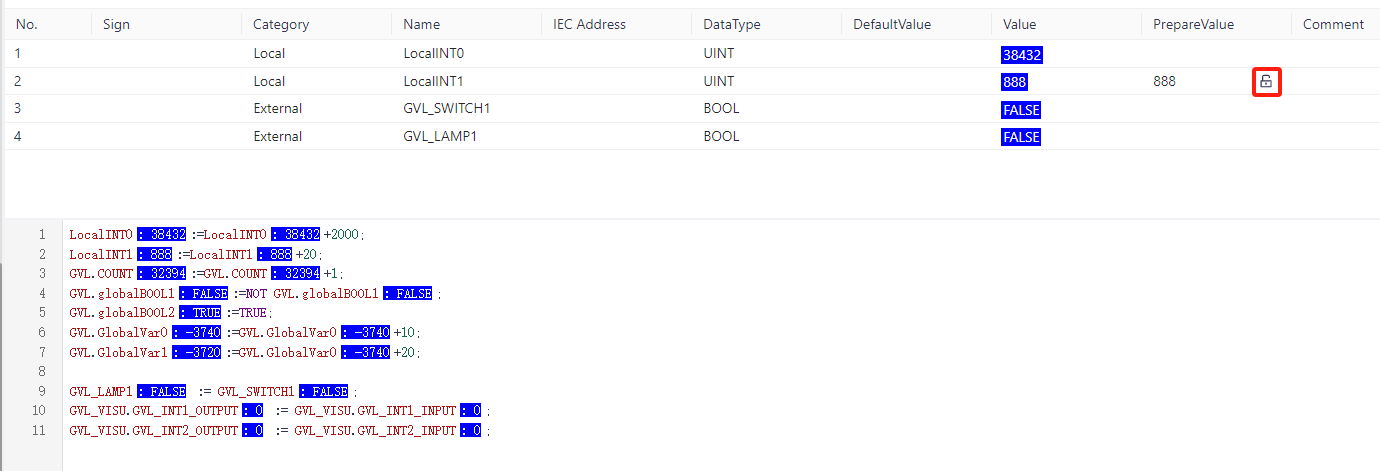
To unenforce it, you need to click the "Unenforce" button.
# 12.6 Simulation Mode
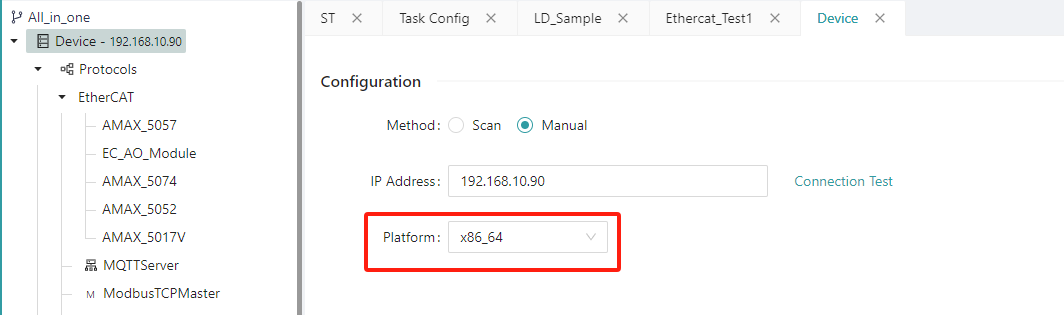
In the absence of a physical device debugging environment, you can use a simulated device to perform program debugging.
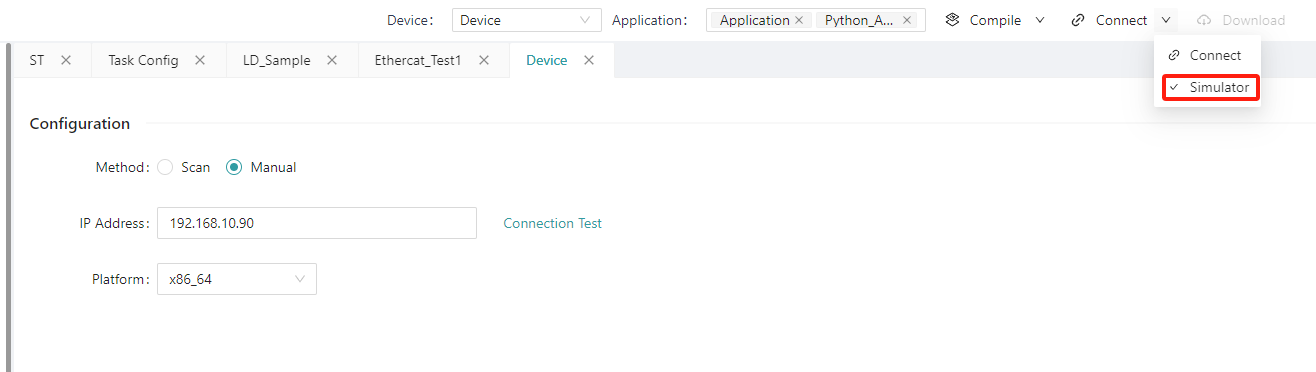
To use the emulated device, under the device configuration screen, the "Target Platform" needs to be selected as "x86_64"
After saving, select the device you need to connect, and then select "Simulated Device" from the drop-down menu on the right side of "Connect Device", and click "Connect Device" after the selection is complete.
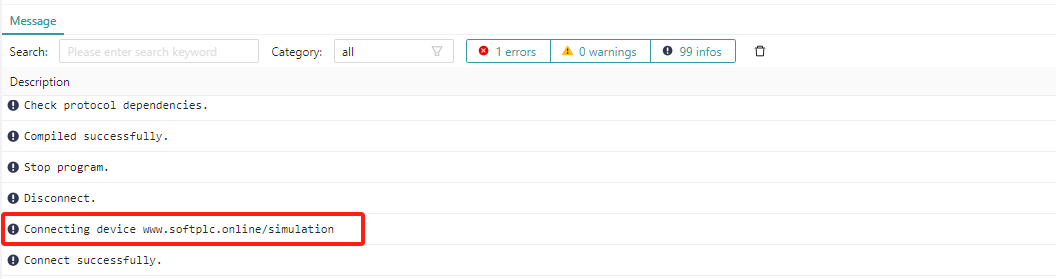
After the connection is executed, you can see whether the connection is successful in the log and status.
After the simulated device is successfully connected, execute "Deliver Program" and "Start" in order to debug the program under the simulated device.